|
Six Sigma quality, the closest thing to
a management fad to have surfaced since the dotcom bust, has passed
its peak, a leading financial newspaper argued several weeks ago.
If Six Sigma continues to follow past patterns, the next stage will
be disenchantment, as companies find that the technique often achieves
less than expected.
Whether this statement is true or false
is not a debate here. More interesting is the assumption behind the
statement: that management trends and quality concepts come and go,
and no matter which ones are in at the moment, they all must serve a
criterionprofitability.
Any quality assurance system must align with this credo.
Lets put the knotty statistics,
procedures, theories, charts, and graphics aside, and instead look at
the core of a quality system. To start with, from a cost-management
point of view, the quality assurance function is a cost center, not a
profit center. To serve the corporate core ideology of profitability,
a pragmatic quality assurance system has to be built and maintained
with the lowest cost possible and accomplish two basic functions:
Monitor
performancedistinguish the good and the bad and report deviations.
Drive continuous
improvementprovide information on current performance and root
causes to guide continuous improvement initiatives.
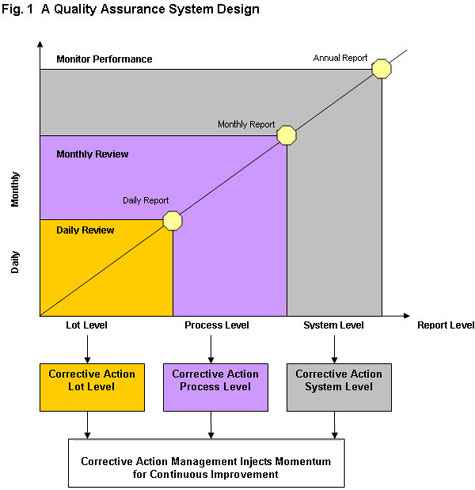 Figure
1 illustrates a design of such a quality assurance system. To monitor
operational performance effectively throughout the organization, the
performance review is divided into three levels based on
organizational hierarchies and time frames. To inject momentum into
continuous improvement activities, each review should define the
weakest links and issue corrective action requests to resolve weakest
links. Figure
1 illustrates a design of such a quality assurance system. To monitor
operational performance effectively throughout the organization, the
performance review is divided into three levels based on
organizational hierarchies and time frames. To inject momentum into
continuous improvement activities, each review should define the
weakest links and issue corrective action requests to resolve weakest
links.
In this design, each of the three levels
of performance review naturally implies a focus for corrective action:
First leveldaily
review of work order/lot performance. In Japan, this is a morning
routine. In five-minute pre-production meetings, supervisors highlight
the major problems of the previous day, and operators discuss how to
prevent them in the future. Focus of corrective actions: improvement
of operators routine activities.
Second levelmonthly
review of summarized process performance. The typical application is a
monthly operational performance review involving a cross-functional
team of managers/directors. Focus of corrective actions: process
improvements.
Third levelannual
or quarterly review of system performance. Best practice is the
annual/quarterly performance review or a scheduled failure modes and
effects analysis (FMEA) review. Focus of corrective actions:
improvement of system efficiency based on long-term performance and
lessons from past failures. Implementing such a design sounds
undemanding; however, the real challenge is to execute the theories
with a reasonable cost. Most of the time, management fashions fade
away because of digressions, high implementation and maintenance
costs, and less than expected outcomes.
Lately, I came across a service-sector
quality system in need of improvement. To expedite the organizations
order-handling process and improve accuracy, the quality manager
initiated a project to collect data on total time spent versus
standard time. Periodically, the total lost-time was calculated as an
indicator of process performance. Can you see what is going wrong
here?
Lets put the question in another form,
and then we will be able to see the problem more clearly: Is the
total lost-time adequate to drive and direct improvements on reducing
processing time and improving order accuracy? Obviously, the answer
is no! More process information is needed to identify the root causes
in order to make improvements. This is a classic example of system
implementation wandering from the core of a quality system, which is
to drive improvement.
So let me reiterate: to preserve the
coredriving improvementthe monitoring system shall focus on
defects and root causes rather than the outcome of a process.
A simple and easy way to maintain optimal
implementation and maintenance cost is to employ a good software
package to manage the whole system. However, selecting the wrong
software could allow minor problems to turn into disasters, increasing
your costs even more.
Here are some practical rules for
selecting a good software package:
-
Above all, the package should be a
database instead of a single-purpose application. Many SPC packages
available on the market are single-purpose applications; they
primarily focus on statistical calculations, and they are not
capable of easing the everyday data-crunching tasks of data
retaining and summarizing and performance reporting and charting.
-
The software package should have the
capability to store and retrieve data such as process input, defect
quantities, defect descriptions, cycle time, etc.
-
The software package should have the
capability to summarize data automatically and generate performance
reports on the three performance review levels mentioned above.
-
The software package should have
corrective action issuing and management capability.
-
Incorporating Quality Knowledge Base
capability will enable quality professionals to learn from past
failures.
If Six Sigma is to
have a lifespan that outlasts management fads and quality trends, it
must continue to serve the ultimate purpose of profitability. This
means driving improvement by dealing with root causes. Granted, Six
Sigma does perhaps start with a stronger focus on process and root
cause analysis than many previous initiatives. Nevertheless, some
management of the overall implementationwhether by using a software
package or another means of monitoring and driving improvementis the
best way of ensuring that it stays true to its focus.
Author: Logan Luo
QIT Consulting, Inc.
Copyright C 2003 ASQ
Six Sigma Forum. All rights reserved.
|